Utility solar Q3 market update: ITC expiration or extension?
By Ryan Edge and Nick Esch
The impending — and now potentially averted — expiration of the 30-percent federal investment tax credit (ITC) for solar was the driving force behind a number of trends in the utility solar market in the third quarter of 2015, boding well for 2016 and possibly beyond.
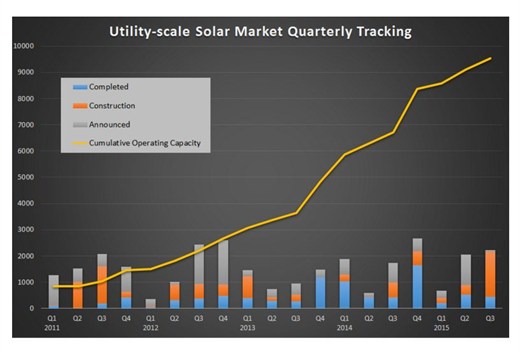
—A strong solar pipeline: Projects totalling more than 1,700 megawatts (MW) — or 1.7 gigawatts (GW) — started construction in Q3, more than in any quarter since the Solar Electric Power Association (SEPA) started tracking the utility-scale market in 2011.
—More PURPA qualified facilities: Signaling solar’s increasing competitiveness with other forms of generation, almost half of the 31 new projects coming online in Q3 were PURPA qualified facilities, as were about a third of the projects breaking ground.
—The post-ITC drop in new projects: As has been widely predicted, the dwindling of new project announcements in Q3 — down to four — reflected developers’ concern about the approaching ITC expiration.
SEPA’s analysis of the utility-scale market focuses on projects of 5 MW or greater. News of a congressional deal on an ITC extension broke as we were finishing this update, and the vote on the bill is now pending on Capitol Hill. The impact of an extension will certainly be positive, but a more detailed forecast at this time would be premature.
Project pipelines and PURPA
Clearly, developers across solar markets have been preparing for the possible expiration of the ITC with a focus on projects they could finish before the incentive’s expected Dec. 31, 2016 deadline. Projects totalling more than 1.7 GW broke ground in Q3, versus 369.2 MW in Q2. This record-breaking quarter brings utility-scale projects under construction nationwide to a total of 6.7 GW.
Source: SEPA research and SNL
Add in the 3.7 GW of projects in advanced development — that is, those with a secured power purchase agreement (PPA) — and the total utility-scale pipeline going into 2016 is more than 10 GW.
That said, the Q3 figures for completed projects were in line with past trends — not remarkable per se, but steady. Thirty-one plants were energized in the third quarter, 10 more than in Q2. The total capacity for the new plants was 439.2 MW, down from the 518.9 MW that came online in Q2, but edging out the 424.3 MW recorded in Q3 2014.
Breaking down the figures geographically, California was, as usual, in the top spot with 12 projects totalling 276.2 MW, followed by Arizona with three projects totalling 75 MW.
Which utility added the most new solar in 2015? Sign up to be part of SEPA’s Top 10 survey here.
While in third place on new capacity — 65 MW — North Carolina had the largest number of projects, 13 5-MW plants all of which, except for one, are qualifying facilities under the Public Utilities Regulatory Policies Act of 1978 (PURPA). In Q3, 14 of the 31 solar projects completed were qualified facilities under PURPA, as are 65 of the 114 projects currently under construction.
Under PURPA, a qualifying facility is a renewable energy project smaller than 80 MW or a cogeneration facility operated by an independent power producer. The law requires utilities to buy power from these facilities if the cost is at their avoided costs for other forms of generation — that is, if it is no greater burden on ratepayers than any other competing resource.
PURPA was originally conceived to provide a market for these power plants at a time when the U.S. energy supply tightened as a result of foreign energy producers. While the law is federal, its interpretation was left to individual states, which determine the avoided cost rate and other parameters for compensating these generators.
Recently, PURPA has provided a boost to solar markets in a few states where long-term PPAs for qualifying facilities are have been at a sufficiently high — and profitable — avoided-cost rate for developers.
Solar projects planned and built as qualifying facilities had been seen in only a few markets in recent years, mostly because the price of solar was higher than the avoided-cost rates. A combination of declining hardware costs and the 30-percent ITC has brought installed costs low enough to make qualifying facility contracts profitable for developers. Without the ITC, qualifying facilities would not be economical in states with higher hardware costs.
North Carolina’s Q3 addition of 12 new PURPA projects is a case in point. The state’s interpretation of the law specifies a 20-year standard-offer PPA for qualifying facilities of 5 MW or less,
The Four Brothers solar plants in Utah broke ground this quarter. Each of the four solar plants is 80 MW, the maximum size for qualifying facilities allowed under PURPA. New Jersey is also constructing three solar plants, totalling 31 MW, which are also qualifying facilities. Other states building solar projects as qualifying facilities include Oregon, with a 5-MW plant; California, with two plants totalling 42 MW; and Georgia, where a 20-MW plant is under construction.
Utilities predominant but not only offtakers
The growing number of PPA’s signed at the avoided-cost rate demonstrate the competitive pricing of solar energy — as do instances of PURPA retrenchments, as has occurred in Idaho.
Earlier this year, regulators in the state amended the its PURPA interpretation so that utilities only have to buy power from qualifying facilities under two-year contracts, down from the previous 20-year contracts. At the time, Idaho Power had 400 MW of solar qualifying facilities approved for interconnection and another 1,300 MW in applications, the sum of which, it argued, exceeded its need for power.
The small change in contract duration chilled the Idaho market. Current data shows nine projects totalling 260 MW in development in the state and due to come online in the last four months of 2016 — at least five of them qualifying facilities. But at this time, none of these projects have yet broken ground.
Utilities were the predominant, but not the only offtakers for the utility-scale projects coming online in Q3.
Another hot utility solar trend in 2015 — community solar. Read SEPA’s latest report here.
Southern California Edison (SCE) is the offtaker for half of California’s new plants, with PPAs for a total of 142.9 MW. Among these is 67.9 MW that represents the first phase of NextEra Energy’s 750-MW McCoy project. SCE is the offtaker for 250 MW at McCoy; the remaining 500 MW have yet to find a contracted offtaker.
Meanwhile, three utility-owned power plants were completed in Q3, Kauai Island Utility Cooperative’s 12-MW plant and two 10-MW plants, owned by Arizona Public Service.
The sole projects without a utility offtaker in Q3 were a 16.3-MW project completed in August at the University of California, Davis, and a 5-MW merchant plant built by NJR Clean Energy Ventures in Wrightstown, New Jersey.
The ITC step-down
New project announcements have been expected to dip as developers fill up their remaining construction capacity ahead of ITC 2016 deadline, and indeed, only four new projects totalling 59.4 MW were announced in Q3. A successful extension of the tax incentive could however spark more announcements in future quarters, however.
The table below illustrates the current, expected impact of ITC step-down on the solar market pipeline, with figures tapering off quarter to quarter.
Utility solar projects completed, under construction and announced, Q3 2015
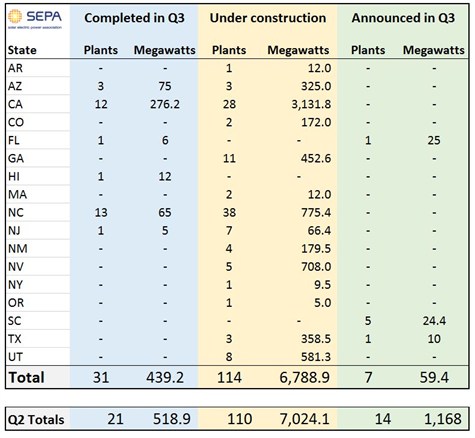
Source: SEPA research and SNL
The most significant difference from Q2 is the sharp drop in new project announcements as the ITC step-down nears. The key factors here, beyond the step-down itself, are developers’ capacity to build and the ever-decreasing lead time for construction ahead of the 2016 deadline.
The construction pipeline shrank by a bit more than 235 MW. Similar to the anticipated drop in announcements, the construction pipeline is also expected to dwindle nearer the end of next year.
Our analysis assumes that the installed costs for solar will not decline more rapidly than already anticipated and no ITC extension will be passed. At the same time, the Environmental Protection Agency’s Clean Power Plan and the recent Paris climate change accords could also drive new demand beyond 2016.
The proposed extension of the ITC now awaiting a vote in Congress does have built-in step-downs over the next several years, but should provide the stability and impetus for sustained utility-scale development into 2017 and beyond. The unknowns now are whether the extension will pass and, if it does, how long it will take for its impact to be felt in the solar pipeline.
Disclaimer
This analysis by the Solar Electric Power Association (SEPA) draws on primary data from SNL Energy and independent sources. SEPA’s quarterly or annual totals may differ from other sources for a variety of reasons. All SEPA megawatts are utility-compatible grid capacity (AC); SEPA’s totals also include only projects 5 megawatts or greater. Project announcement, construction and completion dates can be interpreted differently and assigned to differing quarters or years. Updates or corrections are welcome; send to redge@solarelectricpower.org.
Ryan Edge is a research analyst with SEPA. He can be reached at redge@solarelectricpower.org. Nick Esch is a research associate and can be reached at nesch@solarelectricpower.org.